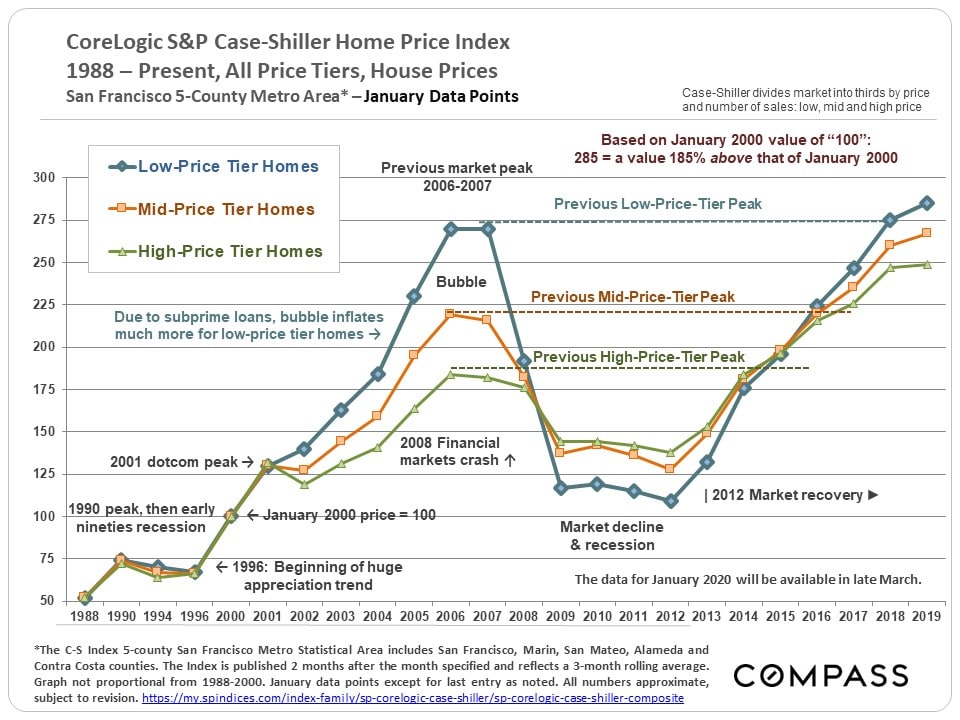
The next chart, also based on S&P CoreLogic Case-Shiller Home Price index data, illustrates an important point about the last market bubble and crash: Different price segments experienced bubbles and crashes of vastly different magnitudes, mostly due to each segment's exposure to predatory subprime lending practices and the foreclosure crisis that followed. It was the lowest price segment that was most drastically affected by subprime lending: The blue line reveals its vastly bigger bubble and commensurately enormous crash. All Case-Shiller numbers refer to a January 2000 value for any home of "100." Thus a reading of 250 signifies appreciation of 150% since Jan. 2000.
The 2008 crash was an anomaly caused by the fact that tens of millions of Americans bought and refinanced homes with loans they could not afford on day one. Happily, underwriting standards have recovered from the abysmal standards of the subprime bubble. That and low-interest rates, so far, have kept mortgage debt well out of the danger zone.
It's also interesting to note on this chart that when the dot-com bubble popped, only the higher-price home segment was significantly affected (and that relatively briefly), because more affluent households have more assets invested in financial markets, and follow those changes most closely.